Analyzing the Entire Project
Overview
Using a pivot analysis tool, Lightning You can aggregate the number of comments registered in the Review section for each specified field and review them. You can specify multiple review files to aggregate, allowing you to aggregate and analyze review results for the entire project.
This section explains the content and methods of analysis using the Pivot Analysis Tool.
Pivot Analysis Tool
The Pivot Analysis Tool allows you to analyze multiple review files at once and freely customize the fields to display the aggregated counts.
Setting the Analysis Target
Launching the Tool
To use the Pivot Analysis Tool, launch it from one of the following methods:
-
Launch from the Menu Select [Tools] menu - [Pivot Analysis Tool]. If launched from here, the currently open review file will be set as the target review file.
-
Launch from the Start Menu Select the [Pivot Analysis Tool] shortcut from the Start Menu.
Setting the Target Review Files
Drag and drop the review files you want to analyze into the [Reports] pane of the "Pivot Analysis Tool".
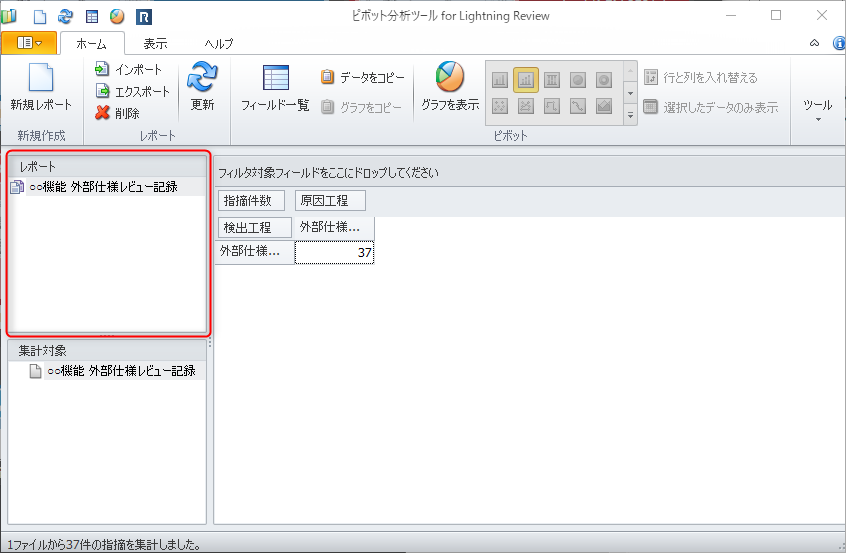
To analyze multiple review files at once, drag and drop the folder containing the review files you want to analyze.
Setting the Aggregation Fields
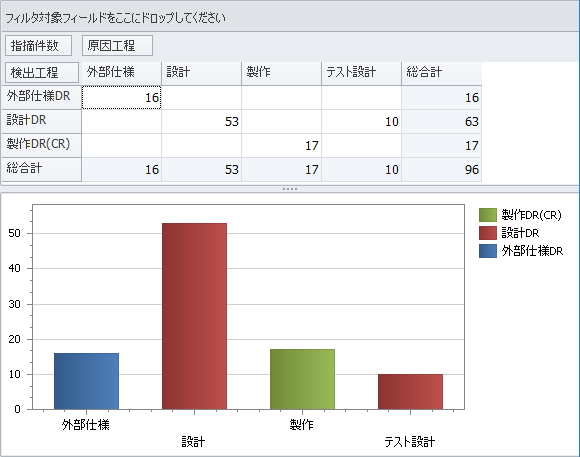
Displays the settings and graphs for the fields to be analyzed.
Initially, the number of findings aggregated in "Cause Process" and "Detection Process" is displayed.
Please change the settings using the following method.
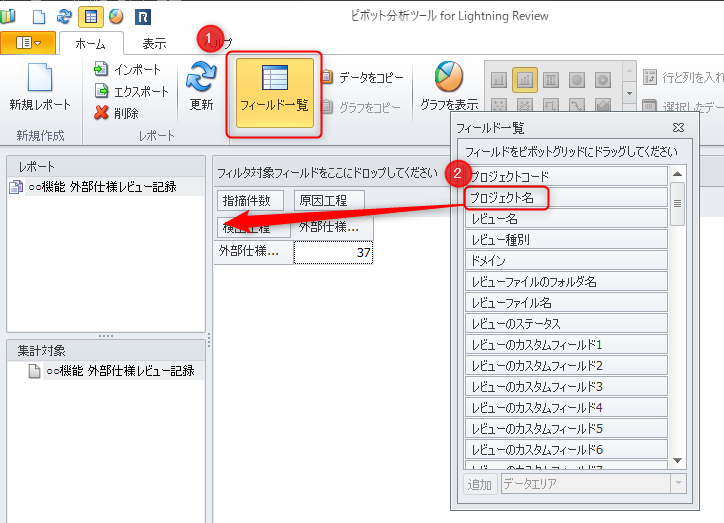
Adding Fields
- Click the [Field List] icon in the menu to display the [Field List].
- Drag and drop fields from the displayed [Field List] dialog box into the pivot grid to add fields.
Deleting a Field
To delete a field, drag and drop the field from the grid to the field list.
Changing the Order of Aggregated Results
If the items in the fields of the output aggregated results are not in the intended order, you can change the order of the items.
- Select "Set Field Order" from the [File] menu to display the [Define Field Display Order] dialog box.
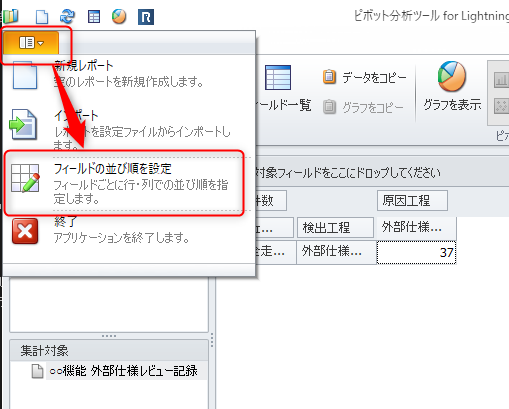
- Select the target field from the [Field] section and change the order of the items displayed in [Display Order].
Separate items with line breaks.
The changed order will be reflected in all reports.
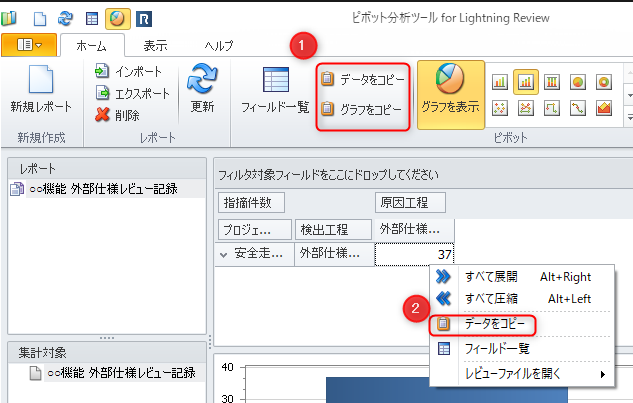
Displaying a Graph
The aggregated results can be displayed as a graph by clicking the [Show Graph] icon in the menu.
Exporting Aggregated Results
The following aggregated results can be copied and pasted into Excel or other applications to be used as a report.
- Aggregated results displayed in the pivot grid
- Graph displayed in the pivot grid
This can be achieved using either of the following methods:
-
Click the [Copy Data] icon in the menu.
-
Select [Copy Data] from the pivot grid's context menu.
For graphs, please select the graph.
Sharing Pivot Analysis Views with Members
Pivot analysis view settings can be imported/exported.
This can be used in the following cases:
- Sharing aggregated information under the same conditions within a group
- When you want to prepare multiple reports with different aggregation conditions for the same review file (duplicating the report)
You can achieve this by clicking either ① or ② below.
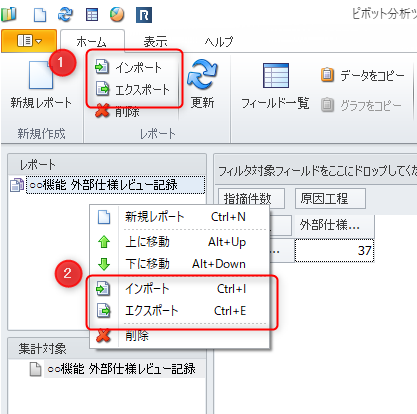
-
The context for ② is displayed by right-clicking.
-
When exporting, please select the target report.
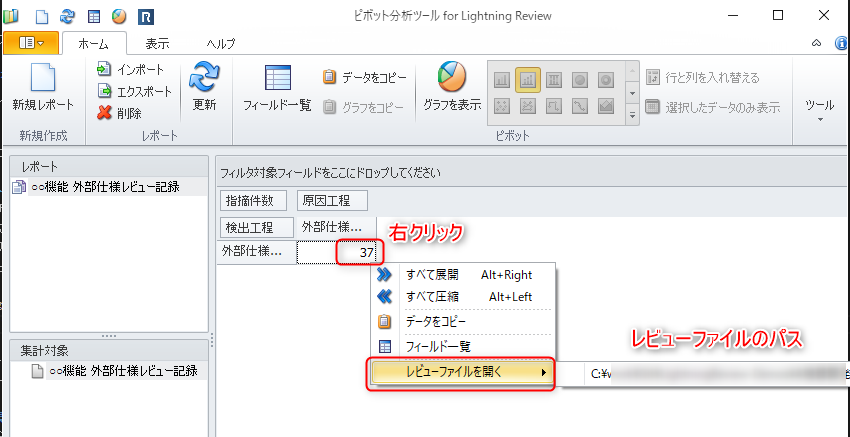
Opening a review file from the aggregated results
You can open the target review file from the aggregated results.
Select the area where the number of items is displayed in the aggregated results as shown in the figure below, and then select the target review file.