Are there any ways to utilize pivot analysis?
Answer
The pivot analysis tool allows you to easily summarize and graph recorded review comments.
Here are some examples of how to use the pivot analysis tool.
Checking the number and rate of defects removed within a process
Set the detection process and cause process fields in the row area and column area, respectively.
As shown in the figure below, you can check the process and number of cases in which defects in the external specifications were detected.
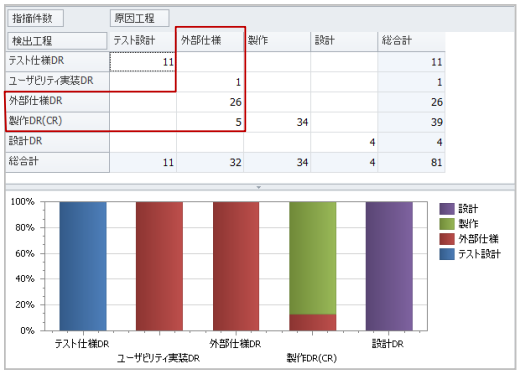
It can be seen that the defects were detected in the following processes.
| Detection Process | Number of Cases |
|---|---|
| Usability Implementation DR | 1 case |
| External Specification DR | 26 cases |
| CR | 5 cases |
Identifying Processes that Introduced Critical Defects
Set the cause process and type in the row area, and the severity field in the column area.
In the example, you can see that many high-severity defects were introduced in the external specification process.
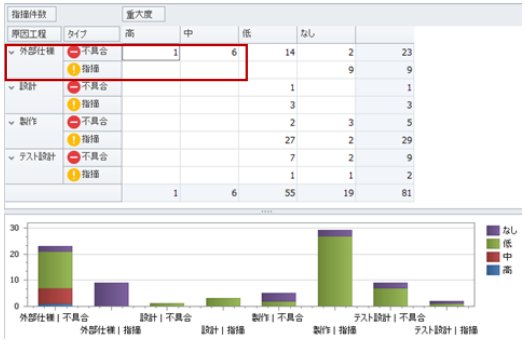
You can take action to improve based on these analysis results.
Example: Check the process execution status of the external specification creator.
Checking the Status of Issues Addressed in Review Files
Set the review file name in the row area, and the status field in the column area.
As shown in the diagram, you can check the trend of issues pointed out for each review.
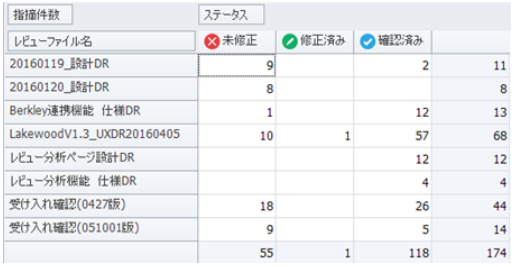
Example: How many uncorrected, corrected, and confirmed issues are there?
Unlike Review Explorer, it's convenient because you can include any file as a target.